Multi-Variable Comparison & Correlation Plot (MVCCP)
Checked variables will have their figure shown below. Uncheck any variable to remove its plot from below.
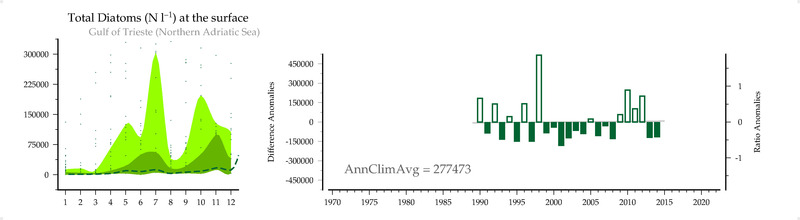
Total Diatoms (#/L) at the surface
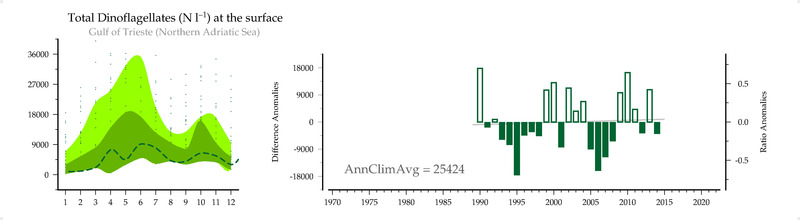
Total Dinoflagellates (#/L) at the surface
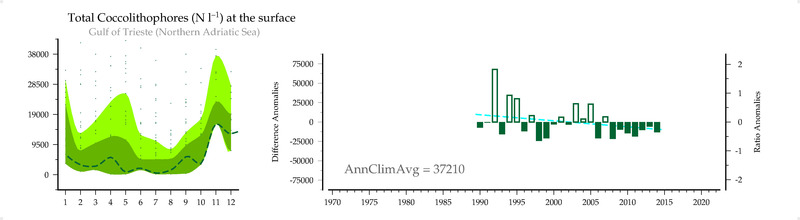
Total Coccolithophores (#/L) at the surface
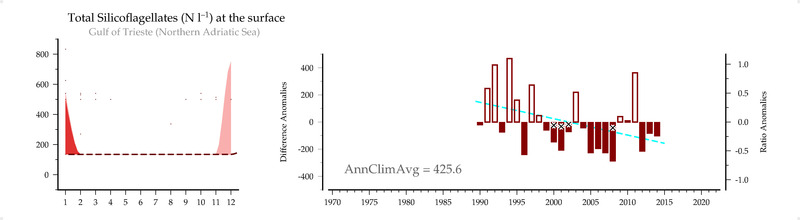
Total Silicoflagellates (#/L) at the surface
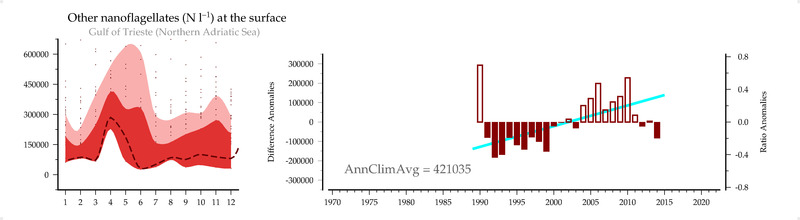
Other nanoflagellates (#/L) at the surface
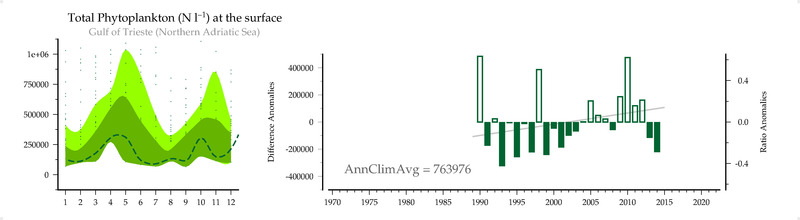
Total Phytoplankton (#/L) at the surface
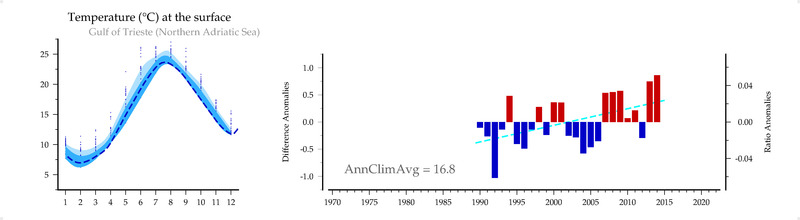
Temperature ( C ) at the surface
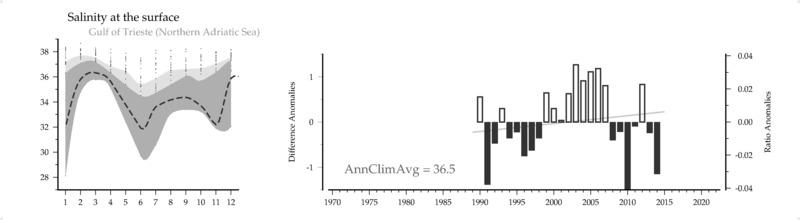
Salinity () at the surface
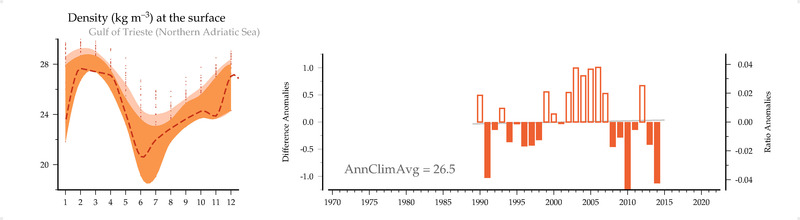
Density (kg/m3) at the surface
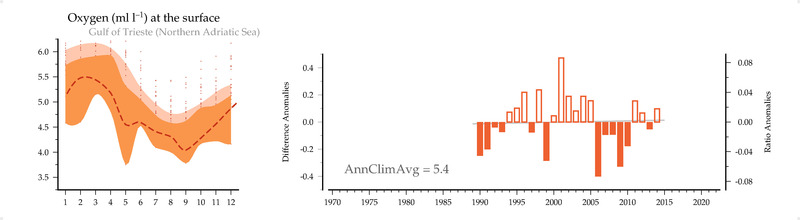
Oxygen (ml/l) at the surface
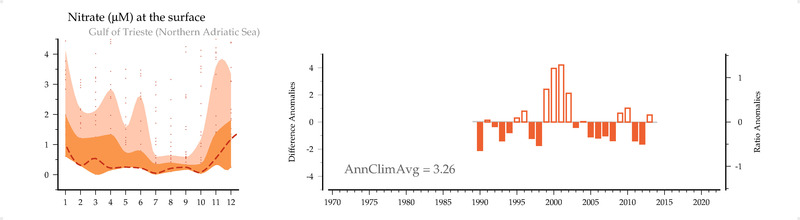
NO3 (uM) at the surface
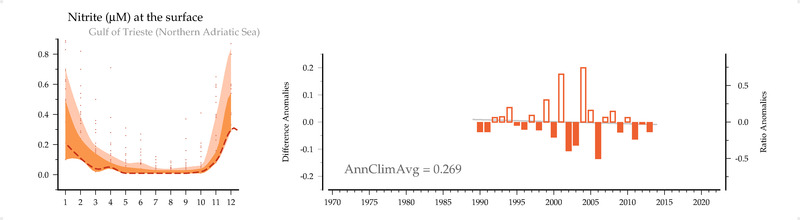
NO2 (uM) at the surface
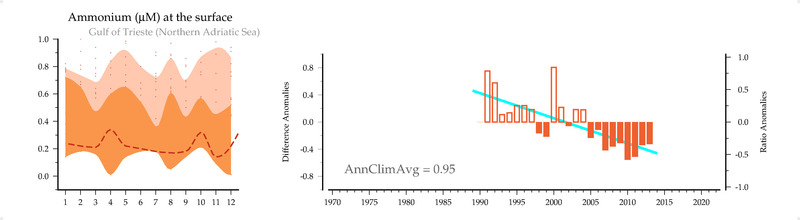
NH4 (uM) at the surface
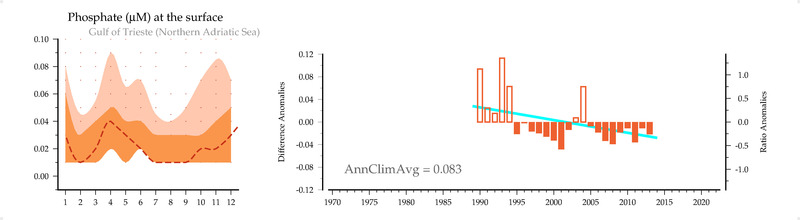
PO4 (uM) at the surface
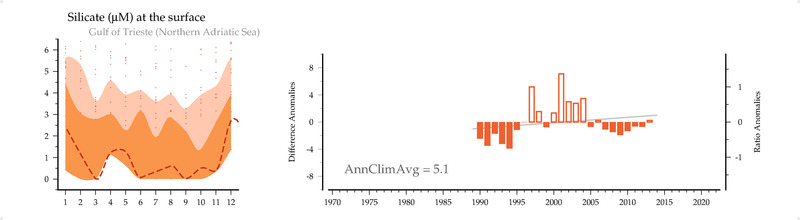
SiO4 (uM) at the surface
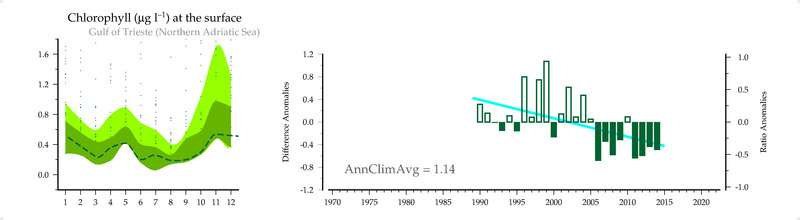
Chlorophyll (ug/l) at the surface
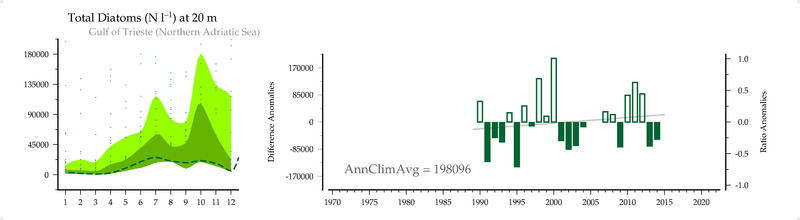
Total Diatoms (#/L) at 20 m
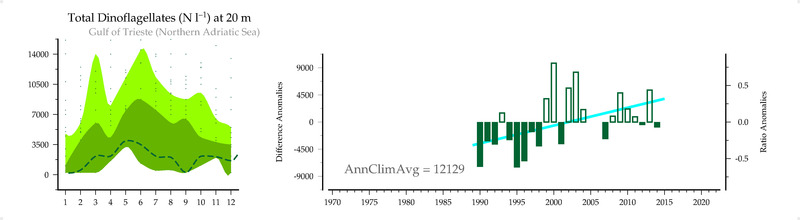
Total Dinoflagellates (#/L) at 20 m
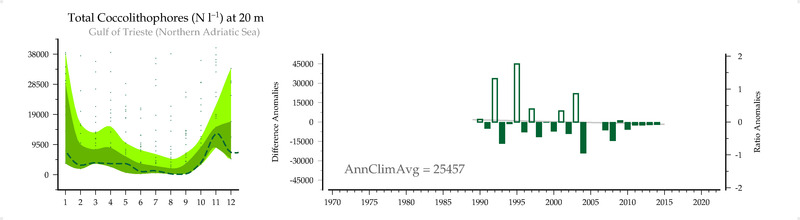
Total Coccolithophores (#/L) at 20 m
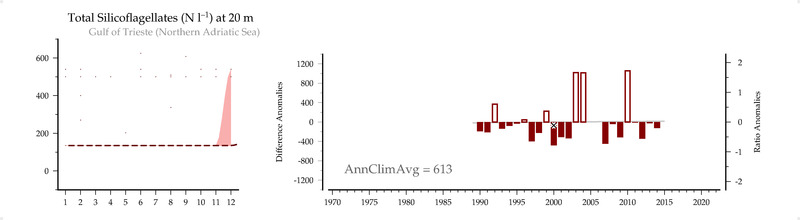
Total Silicoflagellates (#/L) at 20 m
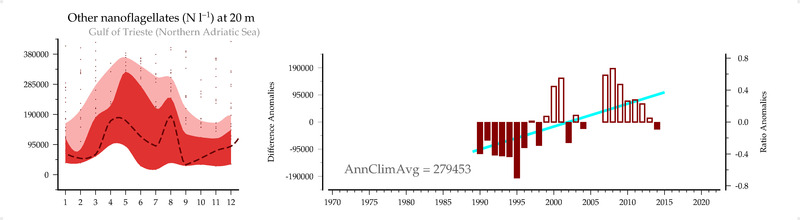
Other nanoflagellates (#/L) at 20 m
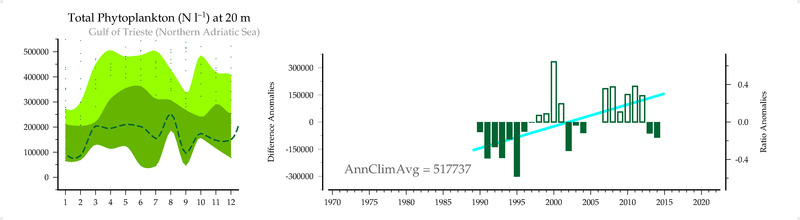
Total Phytoplankton (#/L) at 20 m
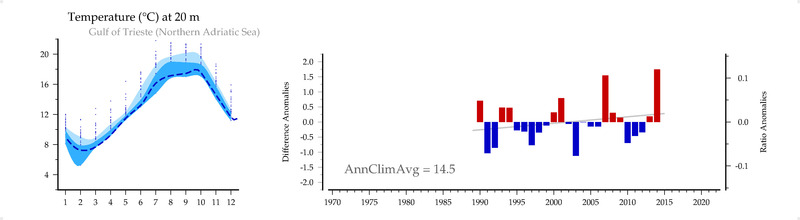
Temperature ( C ) at 20 m
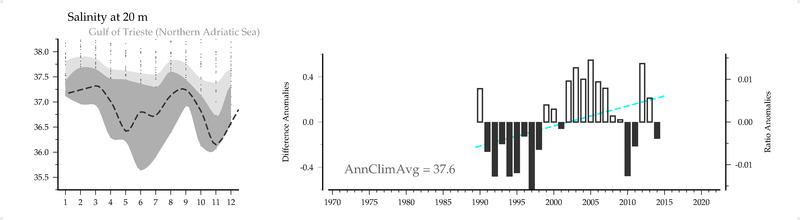
Salinity () at 20 m
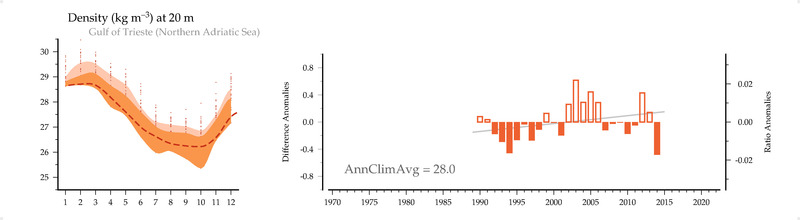
Density (kg/m3) at 20 m
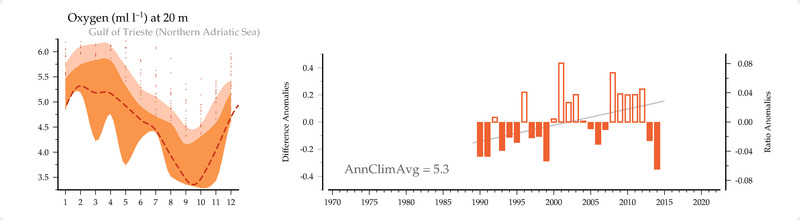
Oxygen (ml/l) at 20 m
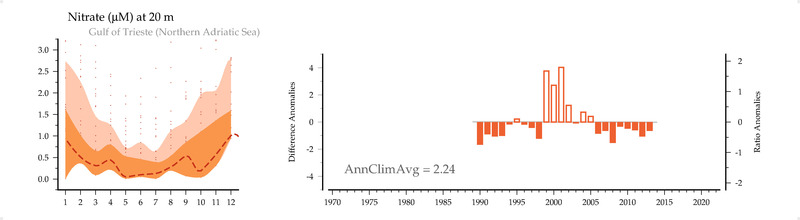
NO3 (uM) at 20 m
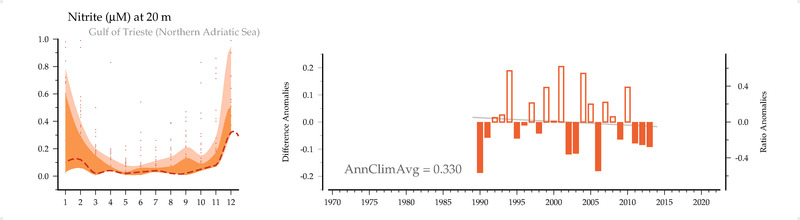
NO2 (uM) at 20 m
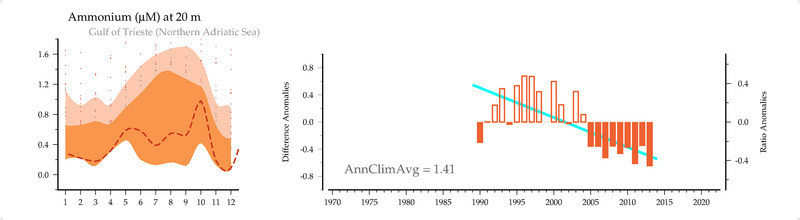
NH4 (uM) at 20 m
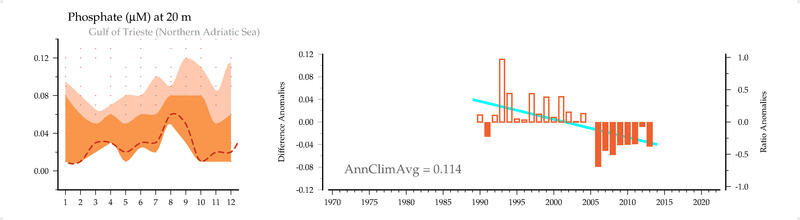
PO4 (uM) at 20 m
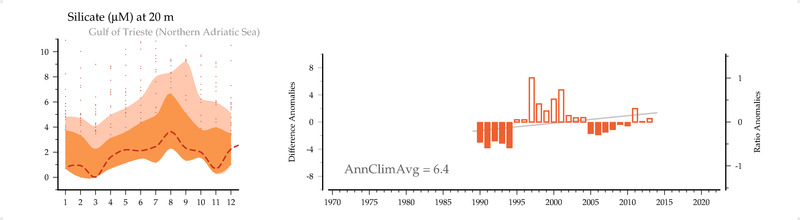
SiO4 (uM) at 20 m
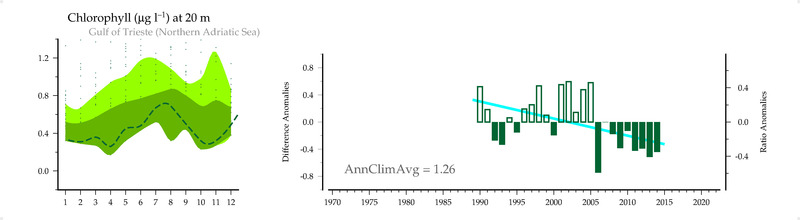
Chlorophyll (ug/l) at 20 m
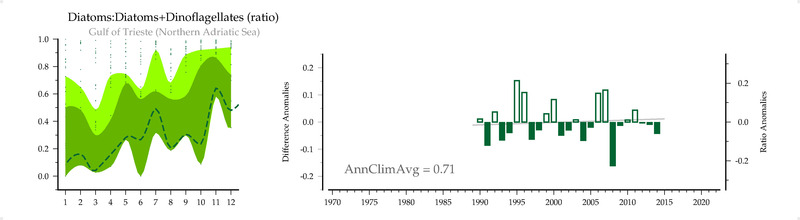
Diatoms:Diatoms+Dinoflagellates (ratio)
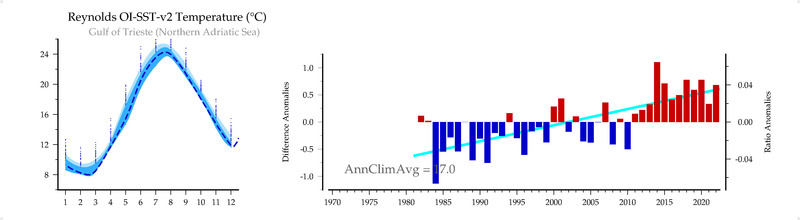
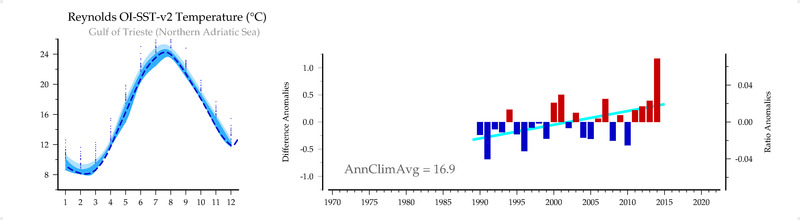
Reynolds OI-SST-v2 Temperature (C)
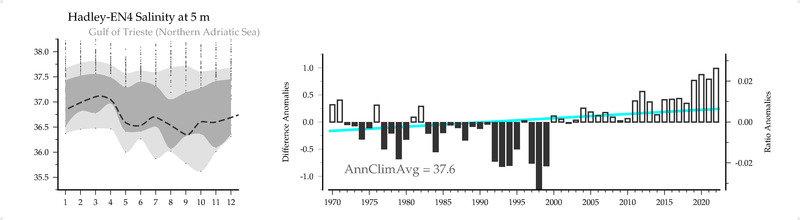
Hadley-EN4 Salinity () at 5 m
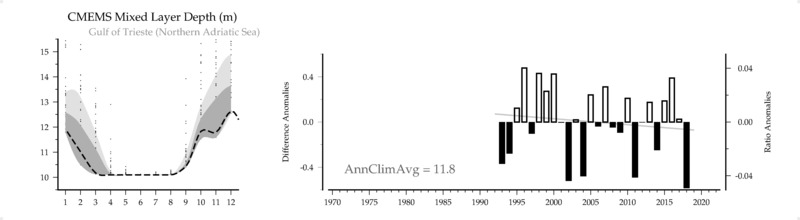
CMEMS Mixed Layer Depth (m)
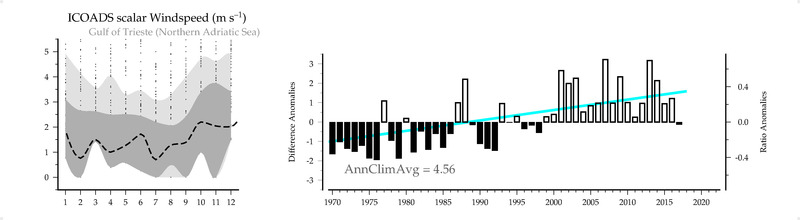
ICOADS scalar Windspeed (m/s)
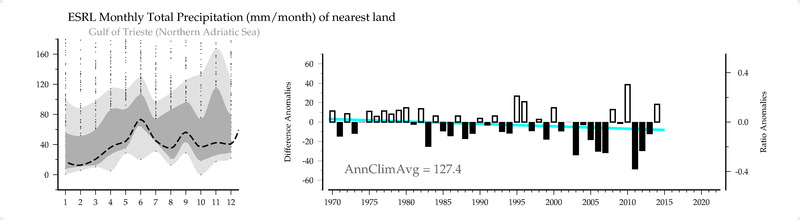
ESRL Monthly Total Precipitation (mm/month) of nearest land
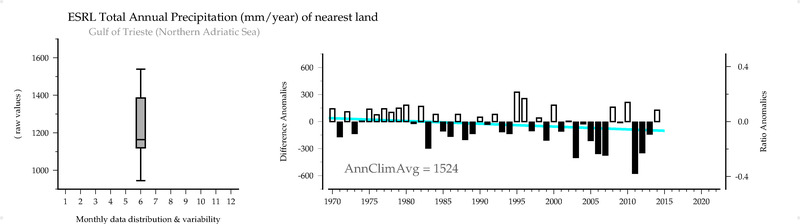
ESRL Total Annual Precipitation (mm/year) of nearest land
Reynolds OI-SST-v2 Sea Surface Temperature (C) from matching years
Reynolds OI-SST-v2 Sea Surface Temperature (C) from 1960-present
Reynolds OI-SST-v2 Sea Surface Temperature (C)